The charts below display water level forecasts and exceedance probabilities for the Mississippi River at Natchez, MS, based on data provided by NOAA. These visualizations include short-term river stage predictions and the likelihood of various water levels being exceeded over the coming week.
The charts are automatically updated as NOAA releases new forecast information, ensuring you always see the most current data available.

Click here to view the interactive charts on NOAA.gov

Click here to view the interactive charts on NOAA.gov
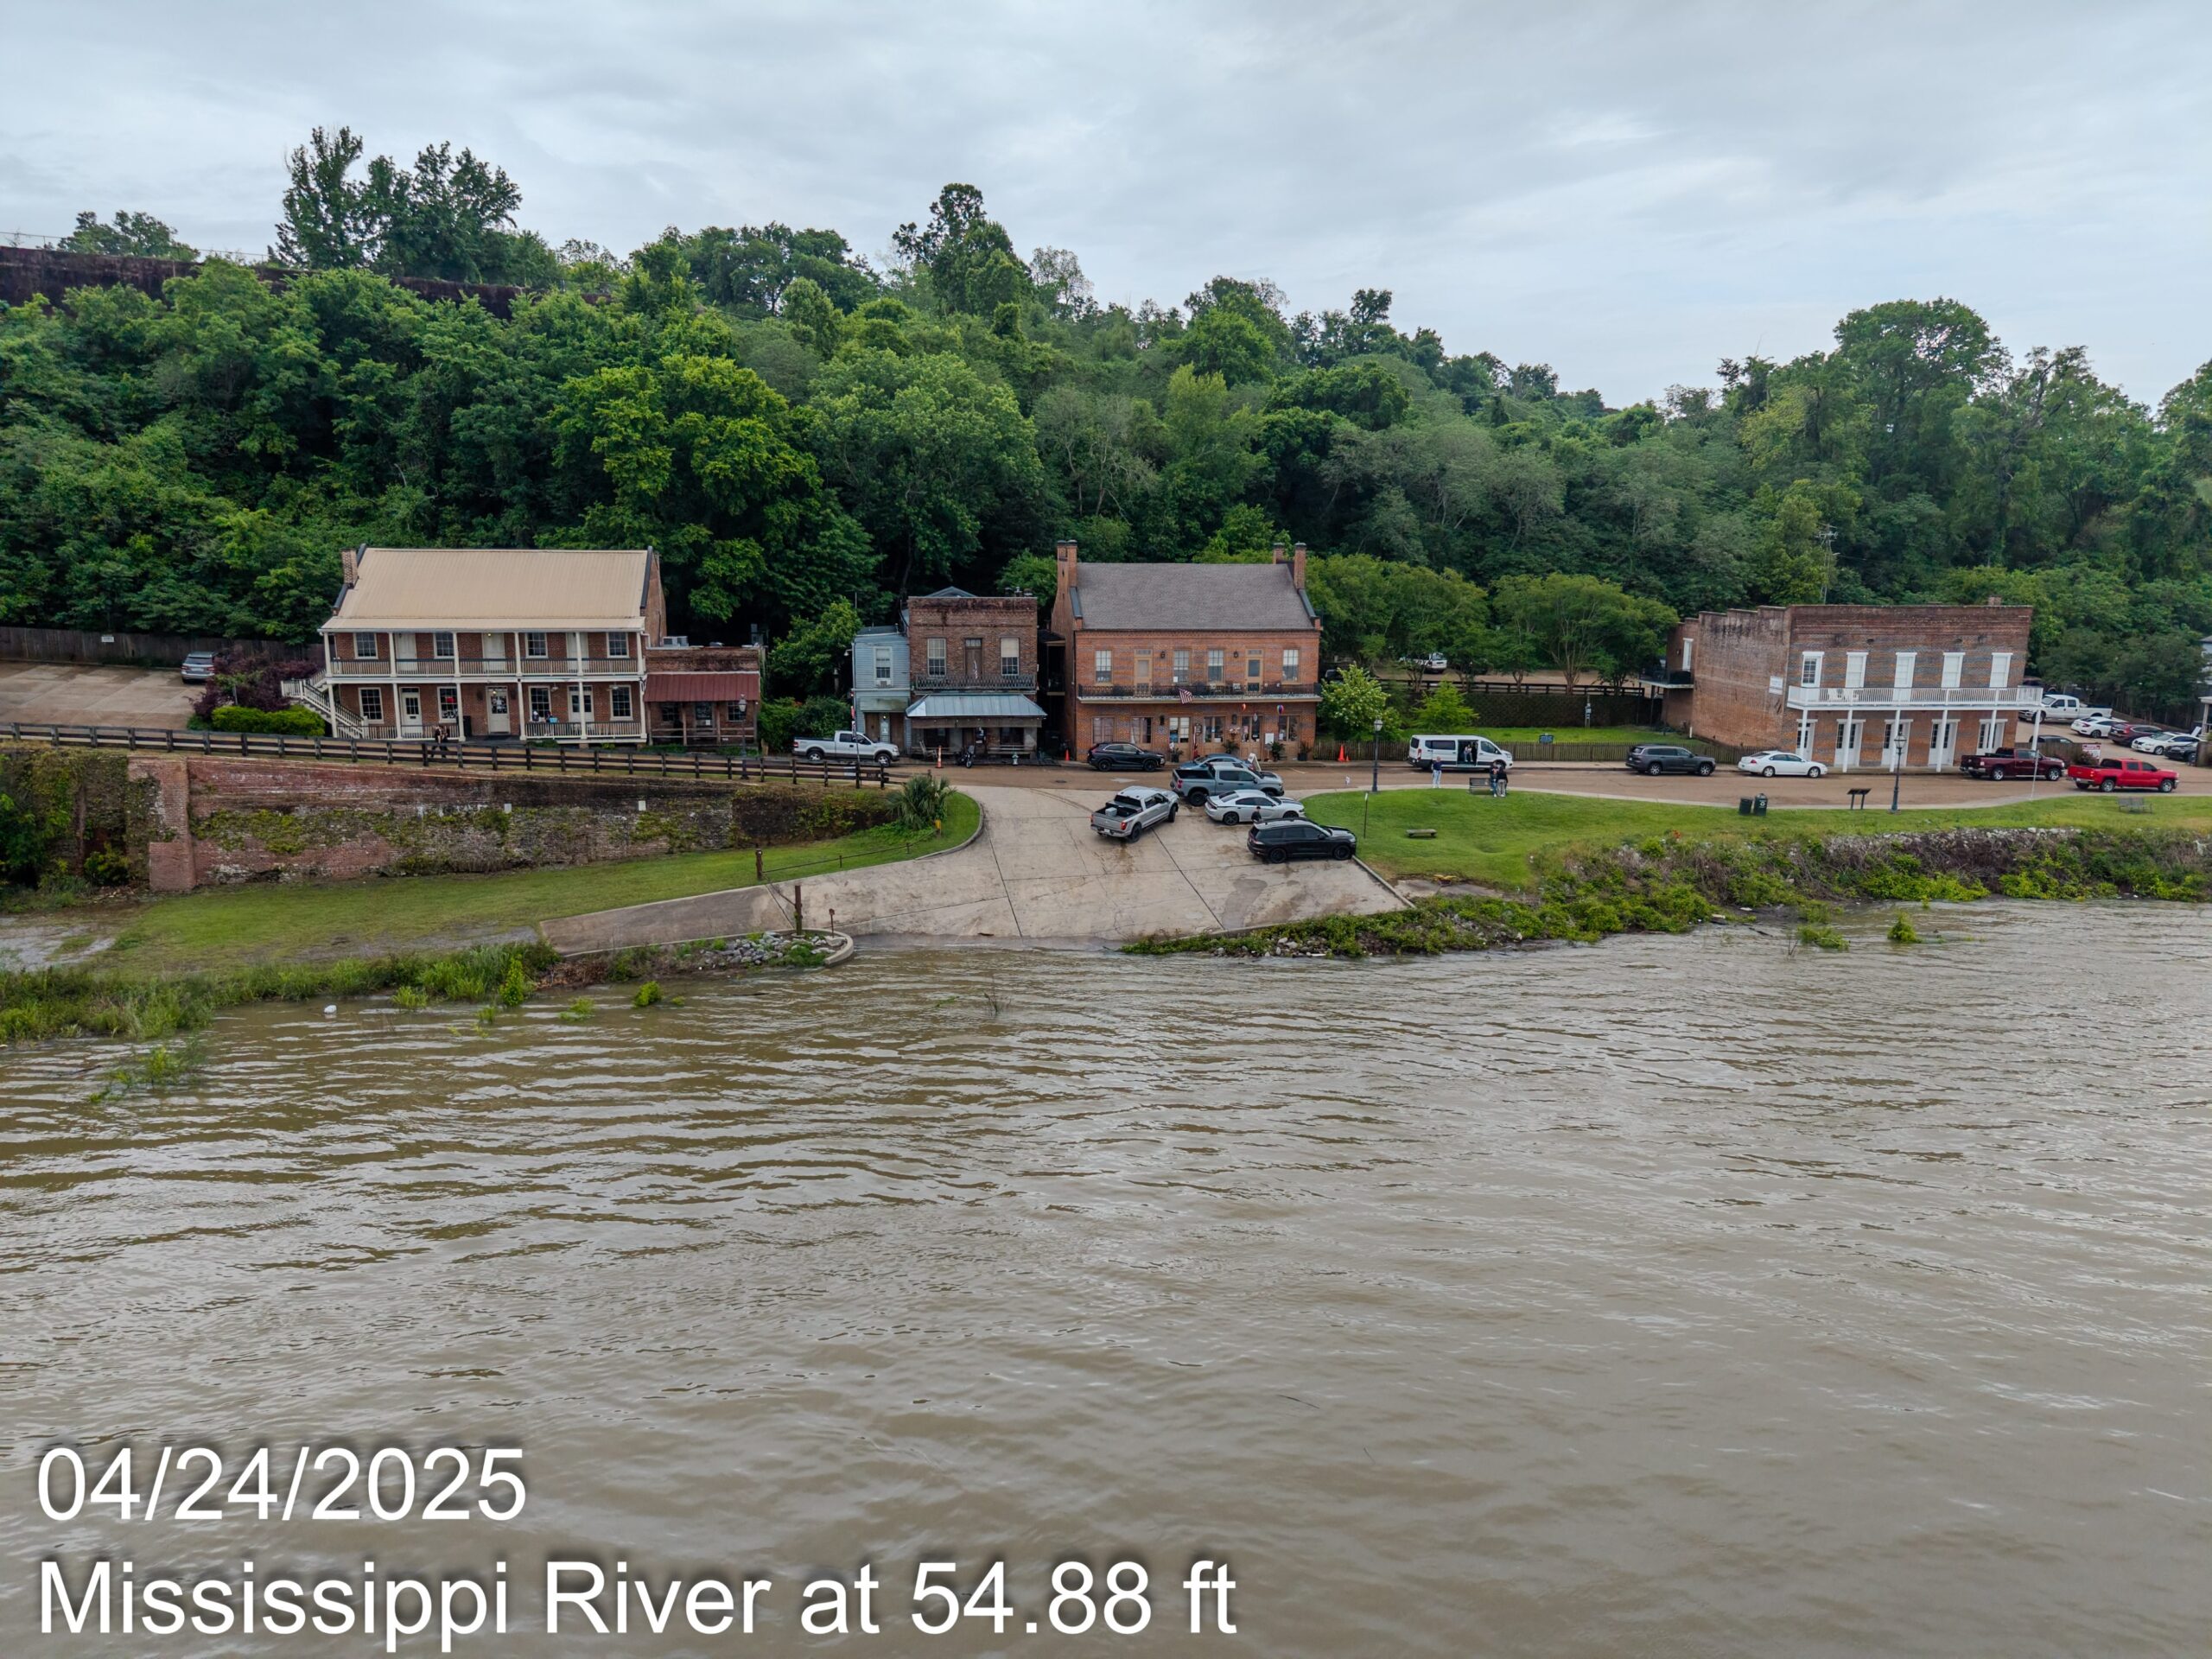
[vc_tta_accordion active_section=”1″][vc_tta_section title=”Mississippi River at 54.88 ft on 4/24/25″ tab_id=”1745526677093-4709ae5c-8f56″][photoGallery widget_name=”Photo Gallery” display_title=”no” galid=”47298″ items=”10″ columns=”1″ paginate=”yes”]
(Photos by Josh Wells | Listen Up Y’all Media)
[/vc_tta_section][vc_tta_section title=”Mississippi River at 54.3 ft on 4/23/25″ tab_id=”1745439232679-ed818805-51ea”][photoGallery widget_name=”Photo Gallery” display_title=”no” galid=”47295″ items=”6″ columns=”1″ paginate=”yes”]
(Photos by Josh Wells | Listen Up Y’all Media)
[/vc_tta_section][/vc_tta_accordion]
Leave a Reply
You must be logged in to post a comment.